After presenting how to ingest logs into Azure Sentinel in the first part of this article series on Sentinel, I will now discuss how to:
- develop alert rules to detect malicious behaviour
- create automated responses steps to incidents to help with the incident investigation and response
- define health check controls to ensure everything is working as expected.

Developing alert rules
Once logs have been ingested, the next step is to actually do something with the logs and detect suspicious or malicious activity. This is where Alert rules (also referred to as Analytics rules) come into play.
While Microsoft provide a few standards alert rules to detect well-known malware or other common suspicious activities, it is most likely that developing your own rules will be required. Alert rules rely on log queries defined using Kusto Query Language (KQL).
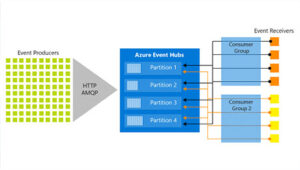
Alert rules work by running the KQL query at a regular interval (form every few minutes to every few days) and generate alerts when the defined criterion is met, e.g. when the query returns at least one result. Each alert can then generate an incident to be investigated or can be aggregated with other similar alerts into a single incident. This is especially important as you don’t want your analysts to investigate independently multiple incidents that are actually identical. The aggregation is based on Entities, which are IP addresses, hostnames, users or URLs. These entities are defined as part of the KQL query and correspond to the different nodes showed in the investigation pane.
Aside from the common settings such as the incident severity, alert rules can be mapped to MITRE ATT&CK® tactics, which can then easily be used to get an understanding of what is your ATT&CK coverage and what can be improved with regards to detecting attackers’ actions.
Creating automated responses steps
From an engineering standpoint, the biggest component of the incident response process is automated response, which is done with Logic Apps (also referred to as Sentinel playbooks).
Automated response for incident can be directly set up when defining the Alert rules. One or more playbooks can be created and linked to the rule; when an alert is fired and an incident created, the linked Logic Apps will be automatically run. This can, for instance, be used to send notifications to an analyst team when a critical incident needs to be investigating in priority.
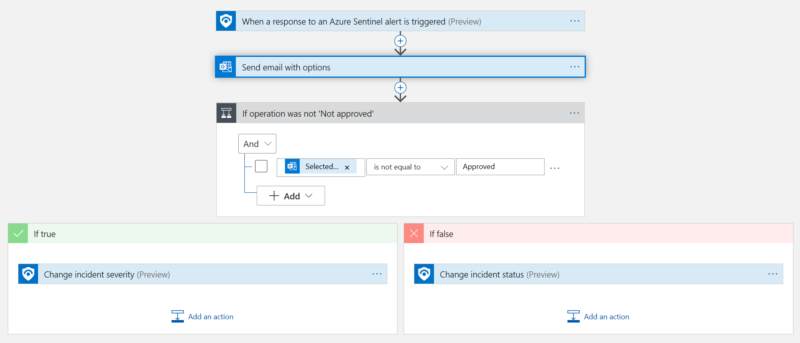
Figure 3. Logic App sending an approval email when an alert is fired
Although these types of automated response can be useful, you don’t necessarily want to send notifications for every newly created incident. In these cases, the automation can come at a later stage of the investigation process, e.g. when an analyst is assigned to an incident or when the incident severity is increased.
Defining health check controls
Overarching all the other components, health check controls is what ensure there is no broken links in the detection process. The best alert rules and incident response process would be pretty useless if the log ingestion process is not working and no logs are received. That’s why ensuring everything is running properly and getting notified when something is broken is key.
To do that, Monitor alerts can be leveraged. Like Sentinel, Monitor can be seen as an overlay of a Log Analytics workspace, but it focuses on resources availability and performance rather than security.
The Monitor alerts development process is similar to the one for Sentinel alerts:
- Create an alert that will fire when the define criteria are met
- Define automated notifications for when an alert is fired
For health check controls, the underlying data used will not be security logs but resources metrics or Activity logs.
One key control you should implement is making sure all the Logic Apps and Azure functions are running without errors; this can be achieved via the Failed runs metrics. If you are using virtual machines, it might be worth to ensure CPU or memory usage is not too high. This can also be using the VM metrics.
Using Activity logs, it is possible to design controls for when Azure resources are modified or deleted; this is especially important in a production environment, where changes should not occur out of the blue. For approved and tested changes, the Monitor alert can then be temporarily suppressed (either globally or only for a subset of resources).
Notifications via Email or SMS can be set up directly in Monitor, but Logic Apps can be used too, like in our case where we send notification messages to our Teams channel.
What next?
Gathering logs, create alerts for malicious activities, defining automated response steps and ensuring everything is working as expected; those are some of the basics steps you’ll have to go through to detect and respond to cyber-incidents.
There is however a lot more than can be done to have well-defined and optimized detection and response capabilities.One aspect we are currently implementing with our client is version control. Sentinel does not provide any version control capabilities, and while you can track who is responsible for the change, you cannot go back to a previous version of an analytics rules or Logic Apps if one change is causing a bug.Another topic being developed is connecting Sentinel with ServiceNow. While Sentinel provides investigation capabilities, it is still lacking the more high-level incident management and tracking capabilities ticketing systems have.
Stay tuned if you are interested to learn more about how we at Arco IT use Sentinel. The next article will cover the operational side and present how incidents are investigated.