For the last 6 months, my colleagues at Arco IT and I have been helping one of our clients develop their security monitoring capabilities using Azure Sentinel, a Microsoft cloud-based SIEM. If you don’t know what Sentinel is, you can refer to the previous article presenting the Microsoft SIEM platform. In this article, I will give an overview of the engineering work that I did and present how to ingest logs into Sentinel.
Ingesting Logs into Sentinel
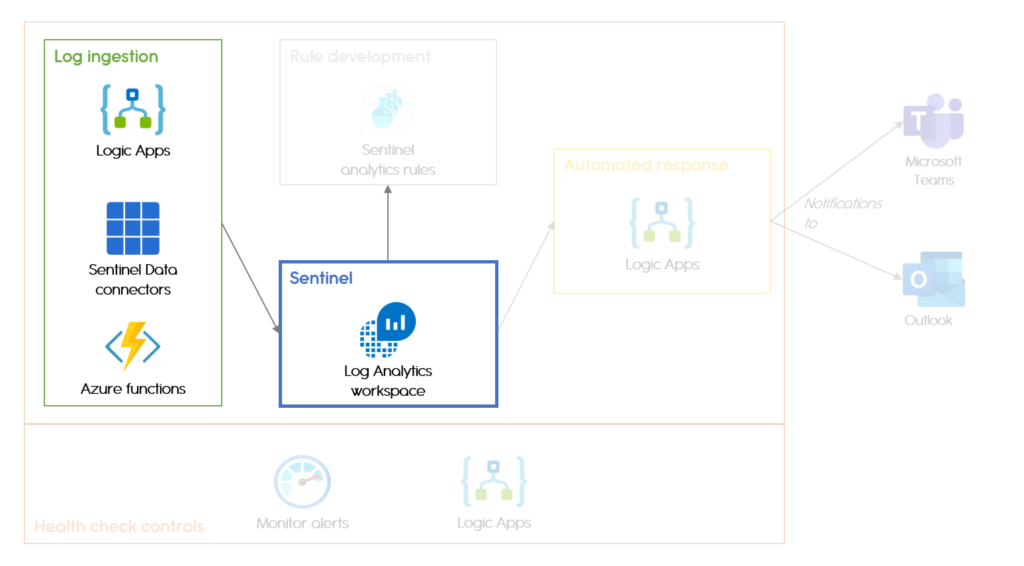
The first step of detecting cyber-incidents is getting logs into your platform. The log ingestion in Sentinel (or more precisely, in the underlying Log Analytics Workspace) can be performed in many ways depending on where the logs are originating from.
As the focus of the project is application monitoring rather than endpoint monitoring, I will only briefly mention here that endpoint agents provided by Microsoft can automatically collect Windows Event logs or Linux logs and send these to a specified workspace. Those events can then be found in the Log Analytics workspaces, under Agents management. Of course, endpoint logs from third party tools can also be ingested, either through off-the-shelf connectors or using the methods I describe below.
The simplest way to add logs to Sentinel is by using one of the standard data connectors provided by Microsoft, which only requires a few clicks to set up. 54 data connectors are currently available for many Microsoft products (Office 365, Microsoft Cloud App Security, Azure Active Directory, and so on) or well-known security product such as Palo Alto or Cisco firewalls. Microsoft is constantly working on developing new connectors; the last batch was released at the end of July and includes connectors for Carbon Black, Okta, or Qualys VM.
When no standard connector is available, the API of the resource can be used to ingest the logs. Using a Logic App running on a recurring basis, the ingestion process is defined as follows:
- query the logs using the resource API
- filter logs and run transforms on them if needed
- send the logs to Sentinel
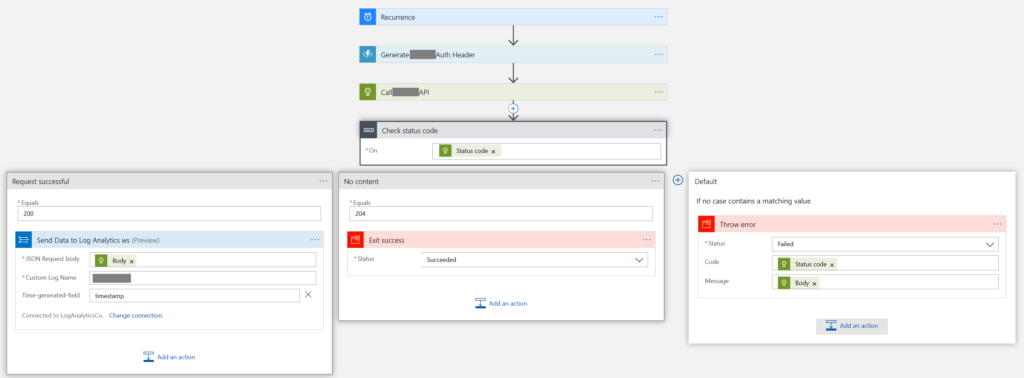
Figure 1. Logic App used to ingest logs using the resource API
A similar process can be used for Azure logs (whether Activity logs or audit logs) when a direct connection to the resource is not possible or not wanted. Application teams might have their own Log Analytics workspaces or already keep their logs in a Storage Account due to e.g. requirements for long log retention period.
For Log Analytics workspaces, the same process applies; the only difference is the initial step where, instead of using the API, the log collection is done through the provided Logic App connector.
For Storage accounts, using an Azure functions that triggers when a new file is added is typically a better choice than the Logic App trigger doing the same thing, as the latter does not work with subfolders. The provided Logic App only triggers when files are added directly in the selected folder, which is usually not the case as Azure splits log files into different folders based on the timestamps
of the events.
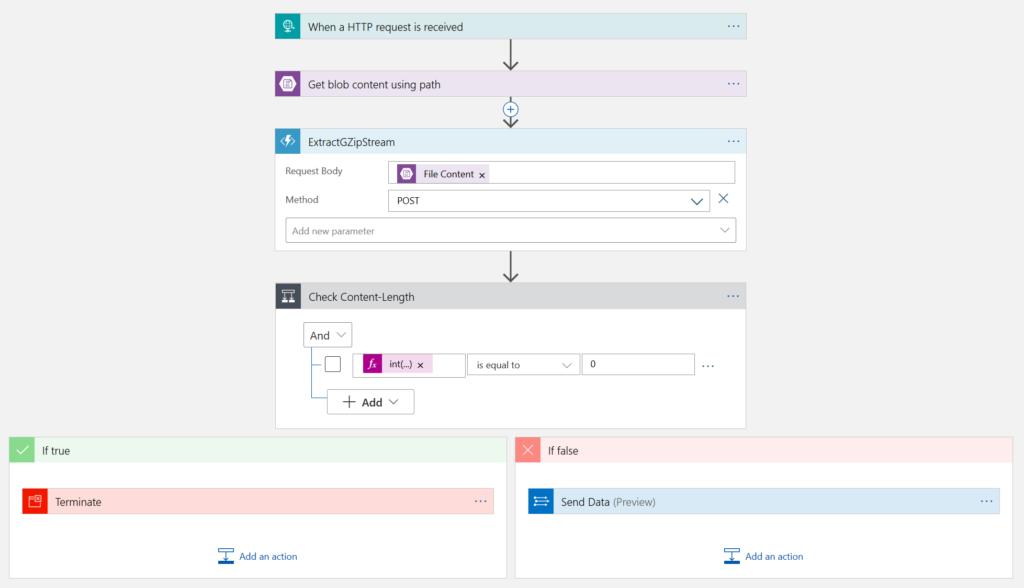

Figure 2.
Finally, Azure Activity and audit logs may be connected directly to a Log Analytics workspace via what is called Diagnostics settings.
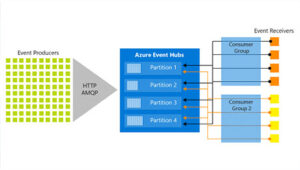
Note: Diagnostics settings can also be used to send logs to a Storage Account, which is equivalent to the solution presented previously, or to an EventHub, which I might cover at a later stage.
Conclusion
Getting logs in your SIEM is the first step to detect malicious activities within your organization. The question that comes then is: what do I do with these logs? In the next installment, I will answer this question and explain how to:
- develop alert rules to detect malicious behaviour
- create automated responses steps to incidents to help with the incident investigation and
response - define health check controls to ensure everything is working as expected

